Overall, 2020 was a record year for the housing finance industry, but not everyone reaped the same gains from it, early analyses of Home Mortgage Disclosure Act data show.
Nonbanks claimed more market share, and annual origination gains for Hispanic, Black and Native American borrowers were weaker than for other groups, according to first-takes on HMDA data by ComplianceTech, Polygon Research and RiskExec.

Given that newly public nonbanks were eager to show shareholders growth as banks became more conservative with credit amid the pandemic, nondepositories took four out of the top five slots for single-family lenders last year, as compared to just three in 2019.
That development could redouble calls for more safety-and-soundness measures for nonbanks from the banking industry, which is concerned about how the growing presence of less-regulated nondepositories could affect the broader financial system.
“Nonbanks are growing, and that is cause for concern by banking trade associations,” said Anurag Agarwal, founder, president and chief architect of RiskExec.
And with early HMDA data also suggesting inequities persist, there could be more policy making toward this end as well.
The proposal to extend a version of the Community Reinvestment Act to nonbanks may address both issues, Agarwal said.
The CRA requires banks to lend equitably in communities where they take deposits. Since nonbanks don’t take deposits, there have been questions about how it could be adapted to their business models, but that may be something policymakers could explore further, he added.
To be sure, the HMDA data available to date is preliminary and has its limitations given that some smaller companies are exempt from the reporting, but generally it’s broadly considered to be a reliable industry benchmark.
What follows are more specific data points and other first-takes on 2020’s HMDA numbers from experts currently analyzing them.

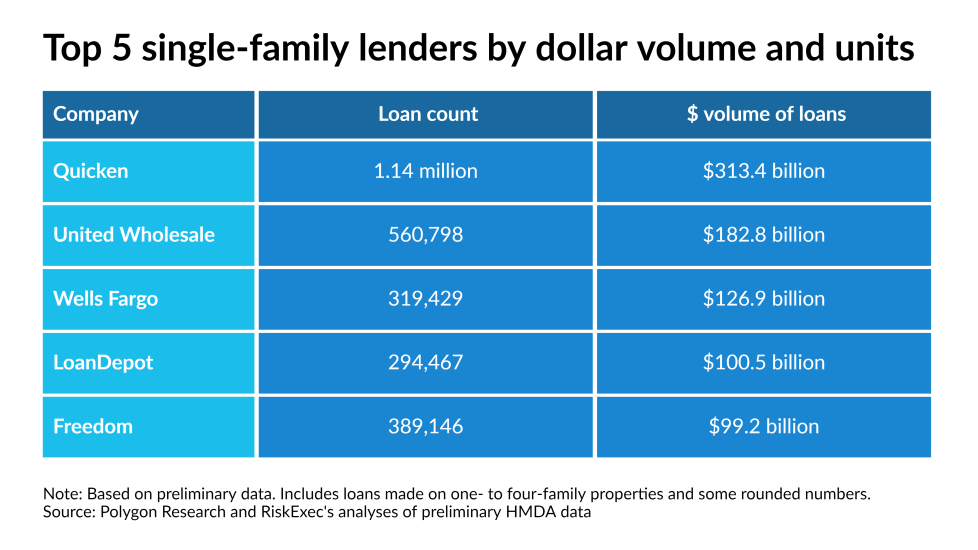
Two nonbanks now top traditional home lending based on dollar amount
Independent mortgage banker Quicken Loans, which became publicly traded as Rocket, held onto its leading position in the single-family rankings based on loan balance as United Wholesale Mortgage took Wells Fargo’s place at No. 2, according to Polygon Research.
United Wholesale Mortgage moved up one slot to No. 2 and loanDepot moved up one notch to No. 5, pushing banks Wells Fargo and JPMorgan Chase each down one notch to No. 3 and 6, as loanDepot and Freedom Mortgage moved up in the rankings.
“Freedom is probably the most striking example of independents understanding the market and executing on that last year,” said Polygon CEO Lyubomira Buresch.
Freedom funded $99.2 billion in one- to four-family loans during 2020 as compared to just $28.6 billion the previous year in a move fueled by strong government lending and refinancing. LoanDepot’s volume rose to $100.5 million from $44.9 million a year earlier.
Quicken funded $313.4 billion during 2020, more than doubling the $141.6 billion it originated in 2019 as it went public under the Rocket name. UWM funded $182.8 billion, compared to $108 billion the previous year.
Some leading banks did experience gains as well, but these were smaller.
Wells Fargo produced $126.9 billion in single-family loans, compared to $110.2 billion the previous year.
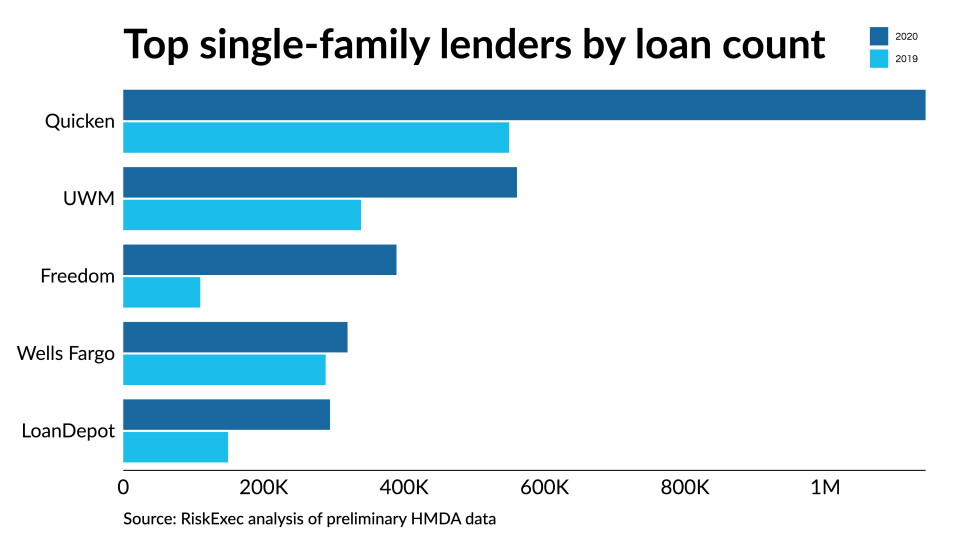
Loan counts highlight divergent activity between banks and nondepositories
Further exemplifying how depositories’ mortgage originations contrasted nonbanks’ last year were loan count rankings, according to RiskExec’s analysis.
Not only did Wells Fargo’s position drop slightly in loan count as it did in the dollar-volume rankings, Bank of America fell far out of the top 5 because its volumes were actually lower for the year. Bank of America descended to No. 9 with a loan count of 184,088 in 2020, compared to 214,321 a year earlier.
At the other end of the spectrum, Quicken’s single-family origination count totaled more than 1.1 million, and UWM’s was 560,789. In 2019, Quicken’s loan count was 549,665 and UWM’s was 338,585. They recaptured No. 1 and 2 slots they’d held the previous year with these numbers.
Freedom Mortgage jumped up to the third rung after ranking 10th last year with a loan count of 389,146, compared to 109,682 in 2019. LoanDepot, which ranked No. 5, had 294,467 single-family originations in 2020 compared to 149,210 in 2019, when it ranked 6th.
Wells Fargo slipped one notch to No. 4 with a loan count of 319,429 this year and 288,291 last year.
Although banks appear to have contracted lending in line with credit restrictions last year, the analysis Agarwal’s done so far on denial rates for the past year suggests to him that denials were lower overall in the past year.
That suggests nondepositories may have loosening credit restrictions enough to offset banks’ contraction, he said.

Originations rose more than 50% on average, but unevenly among borrower groups
While originations to white and Asian consumers were up more than 50% last year, the gains were lower for Hispanic applicants (46%), Native American borrowers (40%), and Black households (38%), an analysis based on ComplianceTech’s LendingPatterns reports shows.
The data appear to bear out historic wealth inequities that make it more difficult for these groups to qualify because they are more likely to lack sufficient credit history and in some cases they may receive lower valuations for their homes due to appraisal bias.
“There’s a lot happening [that could potentially be driving the trend], whether it be approval from the lender in terms of credit quality, or the level of equity and whether or not it’s undervalued,” said Maurice Jourdain-Earl, co-founder and managing director of ComplianceTech.
Deeper dives into the data over time may shed more light on this, he said.
Source: Nationalmortgagenews