As the Alliance publishes this updated version of the State of Homelessness, COVID-19 is creating a health and economic crisis in America and throughout the world. It is too soon to determine its ultimate impacts. Thus, this year’s report represents a baseline—the state of homelessness before the crisis began. It also reflects some early considerations and predictions about the influence of the pandemic on this vulnerable population.
Homelessness in America
Seventeen out of every 10,000 people in the United States were experiencing homelessness on a single night in January 2019 during HUD’s Annual Point-in-Time Count. These 567,715 people represent a cross-section of America. They are associated with every region of the country, family status, gender category, and racial/ethnic group.
Large Subpopulations. Certain subpopulations are significantly represented within homelessness:
Individuals. Seventy percent of people experiencing homelessness are individuals who are living on their own or in the company of other adults. The remainder (30 percent) are people in families with children.
Males. Homelessness is significantly defined by gender. Sixty percent of all people experiencing homelessness are male. Amongst individuals, the numbers are starker—70 percent are men and unaccompanied male youth.
Unsheltered. Far too many people in America sleep outside and in other locations not meant for human habitation. This group includes more than 200,000 people (37 percent of the overall population). Among individuals experiencing homelessness, the numbers are more dire—1 in 2 are unsheltered.
Most At Risk. Numerical size is one reason to focus on a subpopulation within homelessness. Risk is another. Some groups are much more likely to become homeless than the national average.
Pacific Islanders and Native Americans are most likely to be homeless in America when compared to all other racial/ethnic groups. Within the former, 160 people experience homelessness out of every 10,000 compared to the national average of 17 out of every 10,000. Pacific Islanders and Native Americans are numerically small groups within the U.S., making it more difficult for the U.S. Census Bureau and homelessness services systems to count them accurately. Nevertheless, available data suggest they face significant challenges.
Black Americans, multiracial Americans, and Hispanics/Latinxs are similarly situated. Group members are far more likely to be homeless than the national average and white Americans.
Prioritized Groups. Researchers and the public policy world have emphasized some additional subpopulations. Chronically homeless individuals are disabled and have experienced long-term and/or repeated episodes of homelessness. They are currently 17 percent of the population. Veterans, who are 7 percent of people experiencing homelessness, are prioritized due to their service to our country. And unaccompanied youth, who represent 6 percent of the population, are a vulnerable age group consisting of those under 25 years old.
COVID-19 Vulnerable. According to the CDC, some individuals are at higher risk of becoming seriously ill from COVID-19. They include older adults age 65 and over. However, people experiencing homelessness age faster than housed people. Research indicates they have physical conditions that mirror those of people 15-20 years older than them. On a single day, an estimated 202,623 single adults experiencing homelessness are over age 50, suggesting they may be uniquely vulnerable to becoming seriously ill during the pandemic crisis.
An additional CDC-identified risk group is people with pre-existing health conditions. Before the current crisis, growing numbers were experiencing unsheltered homelessness—a living situation associated with poor health. A recent study sampled unsheltered individuals from across the country, finding 84 percent self-reporting existing physical health conditions. Only 19 percent of people in shelters said the same.
Trends in Homelessness
Compared to the previous year, homelessness increased by 3 percent in the 2019 Point-in-Time Count. This marked the third straight year of national-level increases.
Despite this negative movement, the long-term trend has been downward. Overall homelessness has decreased by 12 percent since 2007, the year nation-wide data collection began. The current COVID-19 crisis has the potential to diminish or completely wipe out these modest gains.
Subpopulations. Existing progress has been uneven. Subpopulations prioritized in policy and practice (including funding decisions) have made the most impressive gains over the last decade. Veterans experienced the greatest decreases in homelessness—50 percent. Other subpopulations have realized smaller reductions that, nevertheless, are larger than those in overall homelessness. They include people in families (29 percent), chronically homeless individuals (9 percent), and people experiencing unsheltered homelessness (10 percent).
One group is noticeably falling behind all others. Individuals have only realized a 0.2 percent reduction in homelessness over the last decade. Some are veterans, unaccompanied youth, and chronically homeless. These subgroups have been experiencing greater progress than individuals more generally—but they only make up a minority of the individuals population and help to mask the delayed progress of a sizable majority who are not veterans, unaccompanied youth, or chronically homeless.
Individuals are also solely responsible for the national-level increases in overall homelessness that occurred over the last three years. Individual homelessness increased by 11 percent over that period even as numbers for people in families continued to decrease. This upwards trend exists across a broad range of individuals, including the chronically homeless, men, women, and every racial/ethnic group.
States. As with subpopulations, some states are making more progress towards ending homelessness than others.
Thirty states reduced homelessness since the previous year. Long-term trends further highlight the more successful stories. A majority (37) have reduced homelessness since 2007, with the most significant gains occurring in Michigan (-70 percent), Kentucky (-49 percent), and New Jersey (-49 percent).
Other states have more people experiencing homelessness than they did more than a decade ago. Fourteen have seen their numbers increase between 2 and 72 percent over that period. New and decisive action is necessary to ensure these states build real momentum in the fight against homelessness.
Geographic Regions Experiencing the Greatest Challenges
Identifying the regions with the most challenges informs nation-wide efforts to end homelessness.
Counts. One approach is to examine the locations with the highest homeless counts. They include states such as California, Florida, New York, and Texas as well as Continuums of Care (CoCs) serving New York City, Los Angeles, San Francisco, and Texas’ Balance of State. These locations share a common characteristic—relatively large general populations. They include major cities and Balance of States encompassing broad expanses of land (with numerous towns and cities).
Fifty-six percent of people experiencing homelessness are in the five states that have the largest homeless counts. More than 1 in 3 are in the twenty CoCs with the highest numbers of people experiencing homelessness. Thus, much of this national challenge is located in a small number of places, with most jurisdictions having a much smaller problem to manage.
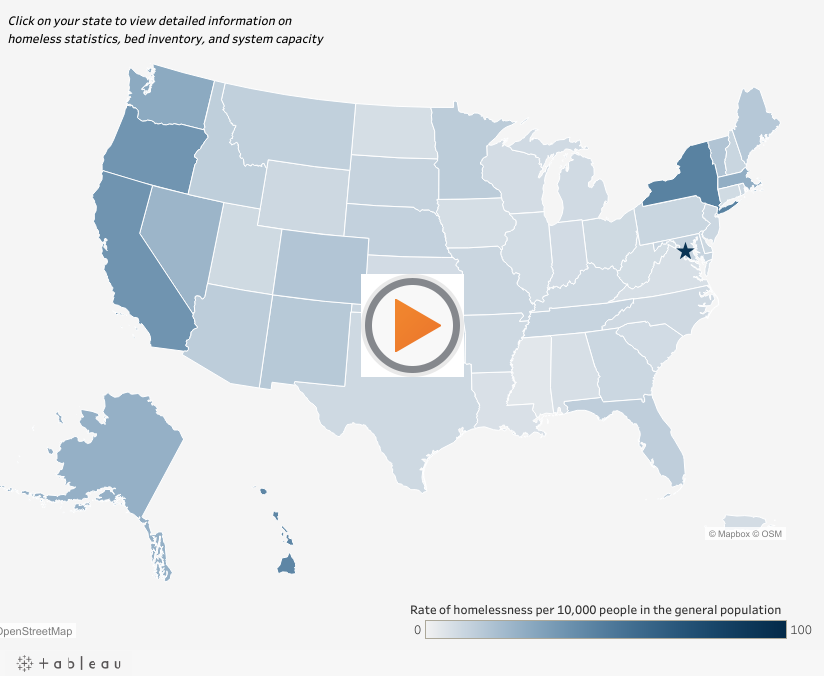
Rates. Rates of homelessness are another way of gauging the severity of the problem within a jurisdiction. They reflect the number of people experiencing homelessness in relation to the general population.
Rates across the country are wildly divergent. Amongst states/territories, the District of Columbia (93 people experiencing homelessness out of every 10,000) and New York (47 out of 10,000) have the highest rates. By contrast, Louisiana (6 out of 10,000) and Mississippi (4 out of 10,000) have the lowest rates. Many homeless people reside in high rate jurisdictions. Forty-five percent are in the five states/territories with the highest rates.
Many of the high rate states and CoCs are associated with other notable housing issues. Researchers and advocates cite many of them as having the highest housing costs and highest rent burdens (housing costs as a percentage of income) in the nation.
Some states and CoCs are anomalies. Their counts and rates defy expectations rooted in overall population size and housing costs. Those states and communities may possess unusual characteristics tied to history, government policy, or culture. Some may have homeless services systems that are either highly effective or falling far short of their potential.
COVID-19. Counts and rates typically offer useful information about the challenges facing homeless systems—they reflect the number of people who need homeless services. During the current pandemic, there is a new challenge—the number of people who contract an infectious illness (COVID-19) while needing homeless services.
Self-quarantine, social isolation, and stay-at-home orders are difficult, if not impossible, to follow when you do not have a home. Thus, the Centers for Disease Control and Prevention has offered guidance on how to best serve people in shelters and unsheltered locations. Meeting COVID-19-related health needs is putting new strain on homeless services systems, especially those with large numbers of infected consumers.
Recent research predicts the number of COVID-19 cases that will arise among people experiencing homelessness in the nation’s counties. Those facing the most severe challenges mainly reside in major cities such as Los Angeles, New York City, San Jose, Seattle, Oakland, San Francisco, Las Vegas, and Phoenix.
Homeless Assistance in America
Homeless services systems do not have enough resources to fully meet the needs of everyone experiencing homelessness. Thus, it is helpful to examine the difficult decisions they must make, including how to allot the limited funds available to them.
Temporary Housing. Over the last five years, the number of temporary housing beds (Emergency Shelter, Safe Haven, and Transitional Housing) has decreased by 9 percent.
A national-level snapshot of these beds during the Point-in-Time count is informative. Individual community circumstances vary. However, in the aggregate, systems were able to offer a year-round bed to only 51 percent of individuals and 100 percent of people in families (the latter with a surplus of over 15,000 beds).
During the winter months, some communities temporarily supplement these year-round beds with seasonal ones. Nevertheless, many people are unsheltered, living on the streets, in abandoned buildings, or other locations not suitable for human habitation. Being unsheltered is mostly a challenge for individual adults, but some families with children are also in these living situations.
COVID-19 is creating a new type of emergency. According to an early estimate, 400,000 new units are needed to prevent the spread of the virus and care for the sick. These accommodations would allow for social distancing, quarantine, and isolation for people who are typically in crowded shelter settings or living unsheltered.
Permanent Housing. While the number of temporary housing beds decreased by 9 percent, the number of permanent housing beds (Permanent Supportive Housing, Rapid Re-Housing, and Other) increased by 20 percent over the last five years.
These numbers reflect a shift in policy priorities. Renewed emphasis is on ending homelessness by moving more people into permanent housing, rather than allowing them to linger indefinitely in shelters and unsheltered locations.
Forty-seven states and the District of Columbia have participated in this trend over the last five years, growing their number of permanent housing beds. Eleven states and territories increased them by more than 50 percent over this short period of years.
Currently, 57 percent of all homeless system beds are designated for permanent housing.
Common Forms of Assistance. Nationally, the most common type of homeless assistance is permanent supportive housing (PSH). Forty-one percent of system beds are in this category which has grown by 96 percent since 2007. Emergency shelter beds, the second most prevalent intervention, have increased by 38 percent since 2007.
Rapid rehousing, the newest type of permanent housing intervention, is continuing along a path of rapid growth. There are 87 percent more beds in this category than there were five years ago.
Transitional housing is the only intervention on the decline—there are 55 percent fewer beds in this category than there were in 2007. This shift is a part of the trend towards more investment in permanent housing solutions.
Populations at Risk of Homelessness
Many Americans live in poverty, amounting to 38.1 million people or 11.8 percent of the U.S. population. They struggle to afford necessities such as housing.
In 2018, 6.5 million Americans experienced severe housing cost burden, which means they spent more than 50 percent of their income on housing. This marked the fourth straight year of decreases in the size of this group. However, the number of severely cost burdened Americans is still 13 percent higher than it was in 2007, the year the nation began monitoring homelessness data.
Another measure of housing hardship is “doubling up,” or sharing the housing of others for economic reasons. In 2018, an estimated 4 million people were in these situations. Some of these people have fragile relationships with their hosts or face other challenges in the home, putting them at risk of homelessness. Over the last five years, this number of doubled up people has been trending downward but is still 12 percent higher than it was in 2007.
Over the last decade, the nation hasn’t made any real progress in reducing the number of Americans who are at risk of homelessness.
Further, few states are realizing significant improvements in these areas. Within the category of severe housing cost burden, Colorado tops the list but has only reduced its numbers by 13 percent since 2007. Over the same period, Colorado is also the state making the most significant progress in the doubled up category—however, its number only decreased by 34 percent. Most states are seeing their severe housing cost burden and doubled up numbers grow.
Sources and Methodology
Data on homelessness are based on annual point-in-time (PIT) counts conducted by Continuums of Care (CoCs) to estimate the number of people experiencing homelessness on a given night. The latest counts are from January 2019. Point-in-time data from 2007 to 2019 are available on HUD Exchange.
Rates of homelessness are a comparison of point-in-time counts to state, county, and city population data from the Census Bureau’s Population Estimates Program, accessed via American FactFinder (table PEPANNRES: Annual Estimates of the Resident Population, 2018 version). Most CoC boundaries align with one or multiple counties, and about a dozen align with cities that are entirely within one county. However, four CoCs align with city boundaries spanning multiple counties (Atlanta, GA; Amarillo, TX; Kansas City, MO; and Oklahoma City, OK). For these, the population was estimated based on prior year trends.
Data on homeless assistance, or bed capacity of homeless services programs on a given night, are reported annually by CoCs along with point-in-time counts. These data are compiled in the Housing Inventory Count (HIC), which is also available on HUD Exchange for 2007 through 2019.
Data on at risk populations are from analyses by the National Alliance to End Homelessness of the Census Bureau’s 2018 American Community Survey 1-year Estimates, accessed via American FactFinder. Poor renter households with a severe housing cost burden are households whose total income falls under the applicable poverty threshold and who are paying 50 percent or more of total household income to housing rent. For people living doubled up, poverty is based on the composition and income of the entire household as compared to the poverty thresholds. A person is considered living doubled up based on his or her relationship to the head of household and includes: an adult child (18 years old or older) who is not in school, is married, and/or has children; a sibling; a parent or parent-in-law; an adult grandchild who is not in school; a grandchild who is a member of a subfamily; a son- or daughter-in-law; another relative; or any non-relative.
Source: endhomelessness